From raw data to decisions

Dashboards people act on.

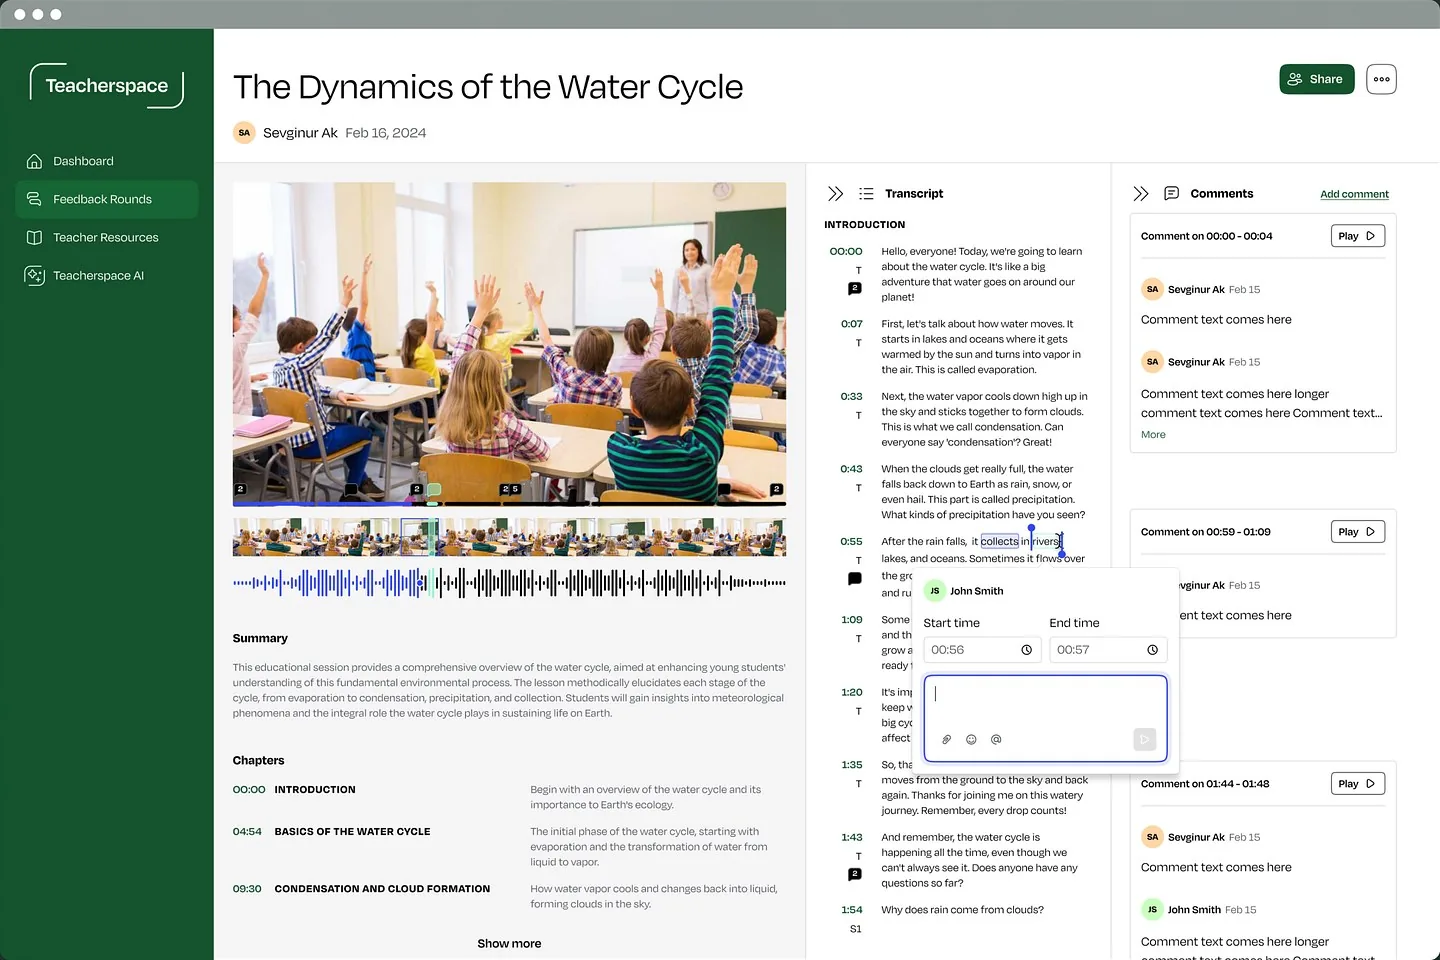
Whether it’s an internal admin tool or a customer-facing report, we design dashboards, tables and charts that show what matters first and make the next step obvious.

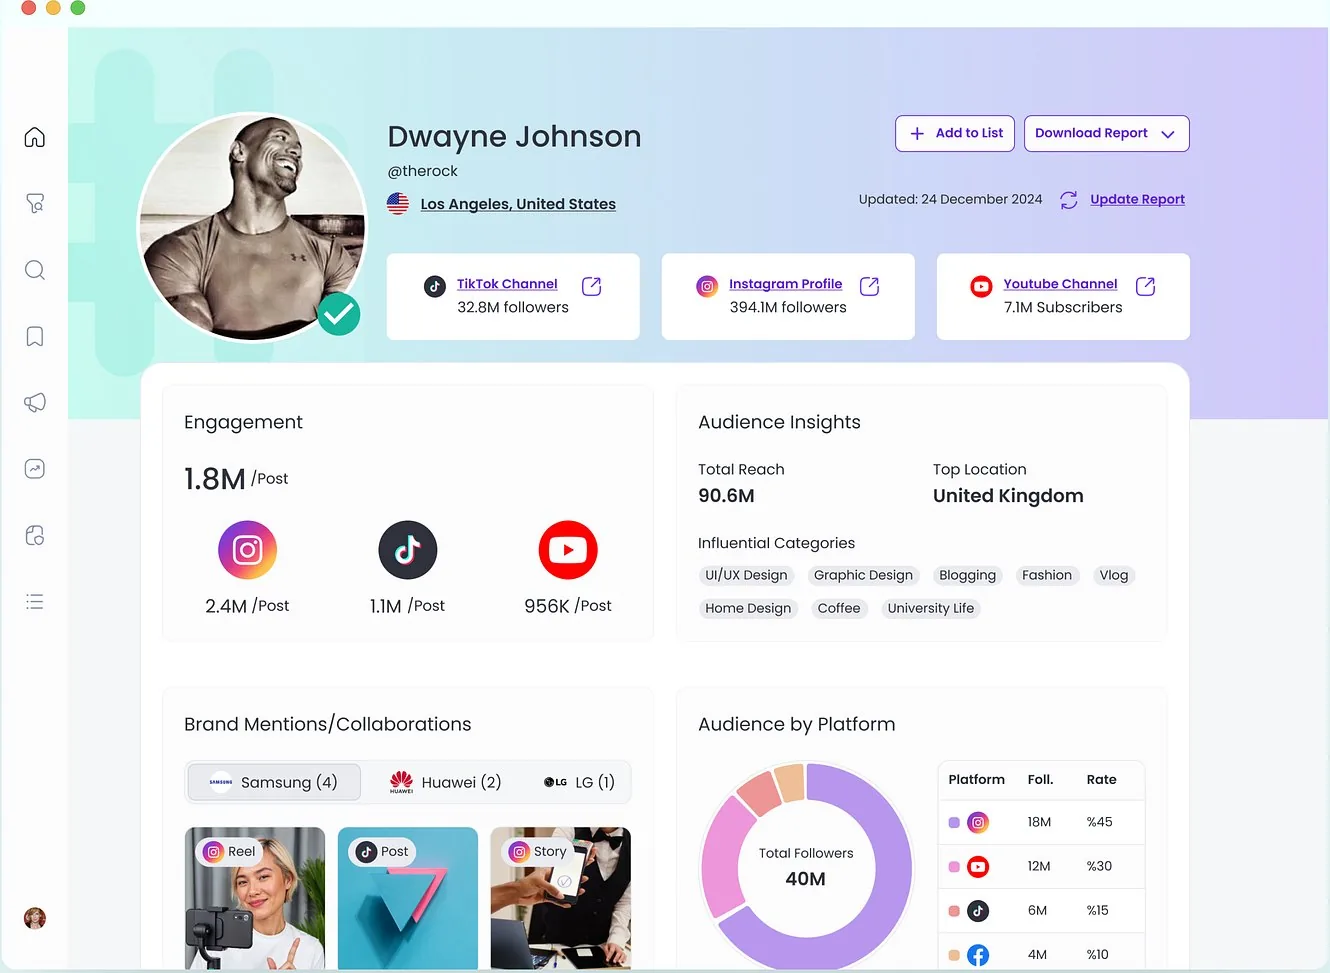
Creator stats dashboard with engagement, audience insights and audience by platform
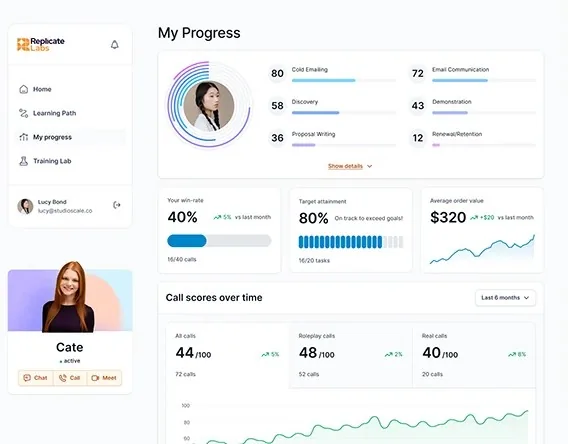
Replicate Labs progress dashboard with skill scores, win rate and call scores over time
win rate7d30d
▲ vs last period

The work

The moments we design

The views people open every day: what changed, what matters and what to do next.

Book a call

The problem

Sounds familiar?

If 2 or more of these ring true, the problem is usually the structure, not the data.

{{ countLabel }}

{{ ctaText }}Book a call

Selected work

Selected dashboard work

Client case studiesScreens on Dribbble and Behance

# Replicate Labs / Progress
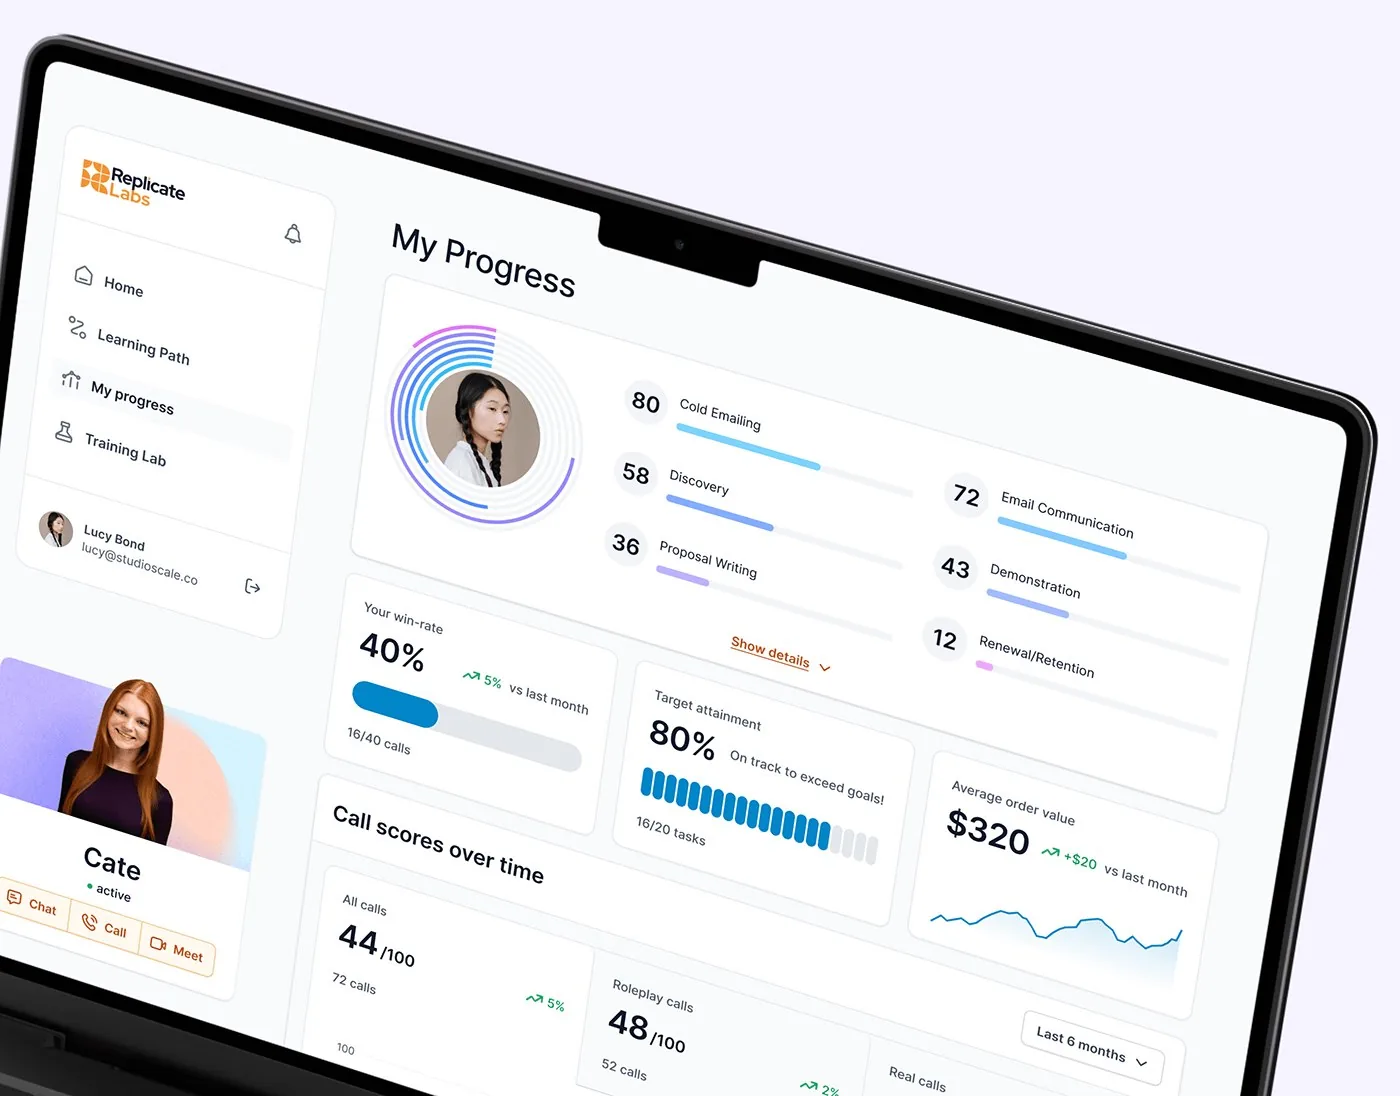
Replicate Labs progress dashboard with skill scores, win rate and call scores over time

Case studyWeb app

A week, measured

Skill scores, call performance and certifications in one progress view, so people know what to focus on next.

Read the case study

# Influencer Marketing AI / Report

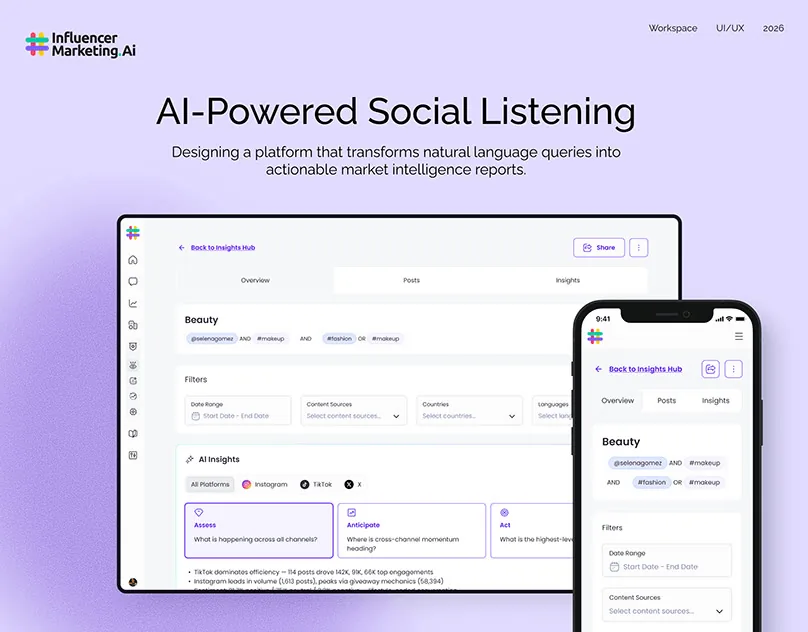
AI-powered social listening report

ScreensWeb app

Ask a question, get a report

Natural-language queries that return structured market intelligence reports.

View on Behance

# Replicate Labs / Home

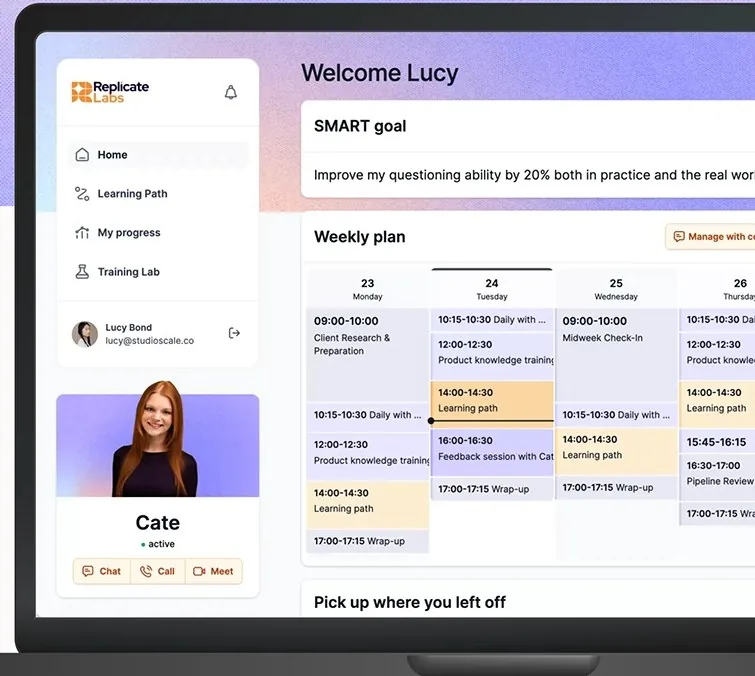
Replicate Labs home dashboard with a SMART goal, weekly plan and the AI coach

ScreensWeb app

Built around the coach

A home dashboard with the user’s goal, weekly plan and recent activity, with the AI coach always in view.

View on Behance

Proof

“We have worked with a number of design and UX experts over the past year and nobody compares to working with Studio Scale.”

James Pursey · Founder & CEO, Replicate Labs
Dashboard projects
9+
Upwork Job Success
100%
Regular clients
10+
Recognized by
Dribbble Select

Ways to start

2 ways to start

Start from your data and goals, or from the dashboard you already have.

  • # New product

    Design your dashboard

    From raw data and goals to dashboards your developers can build.

    • Metrics and user goals mapped
    • Layouts for key views
    • Chart, table and filter patterns
    • Dev-ready handoff in Figma
  • # Existing dashboard

    Fix the dashboard people avoid

    Find what slows people down, then redesign the views that matter.

    • UX review of your current dashboard
    • Prioritized findings
    • Redesigned key views
    • Dev-ready handoff in Figma

FAQ

Questions founders ask

Book a call

See all questions

01Do you build the dashboard?

No. We’re a design studio. You get designs, a clickable prototype and handoff files your developers build from, and we stay on hand during the build.

02How long does a project take?

It depends on the scope. Once we’ve seen the full picture, we’ll share a rough timeline.

03Can you design with our real data?

Yes. We design with real or realistic data, so layouts hold up with long names, empty values and big numbers.

04Can you work with our component library?

Yes. We design with your existing components, or define chart and table patterns if you don’t have them yet.

05Do dashboards work on mobile too?

They can. We decide what each view should show on a small screen, rather than shrinking the desktop layout.
Related capabilities

Explore all capabilities

UX and UI design

Content, features and navigation organized around how users think.

Design systems

Components, tokens and docs that keep design and code in sync.

Complete states

Empty, loading, error and success states, designed before they ship.

Responsive design

Layouts and rules that keep every screen clear, from desktop to phone.

Show us the dashboard nobody opens.

A rough idea is a fine place to start. We’ll get back to you within 24 hours.

Book a call